-
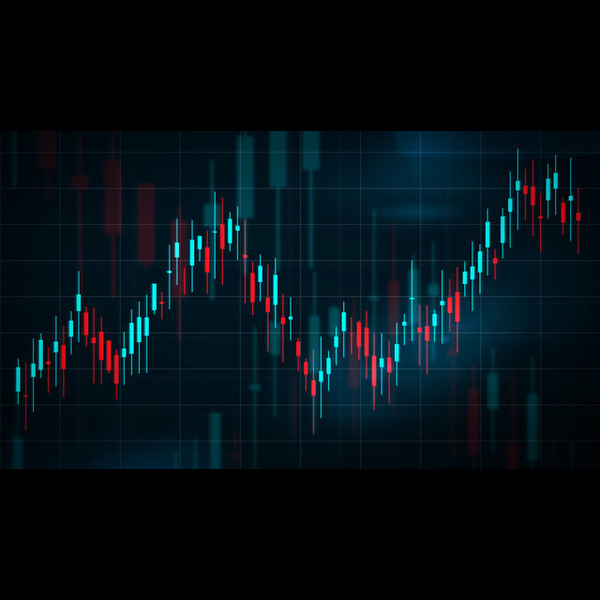
Candlestick charts (Complete Analysis) Er. Janmejay PandeyA candlestick is a way of displaying information about an asset's price movement. Candlestick charts are one of the most popular components of technical analysis, enabling traders to interpret price information quickly and from just a few price bars.

Write a public review